
Decline Graph Options
Click image to expand or minimize.
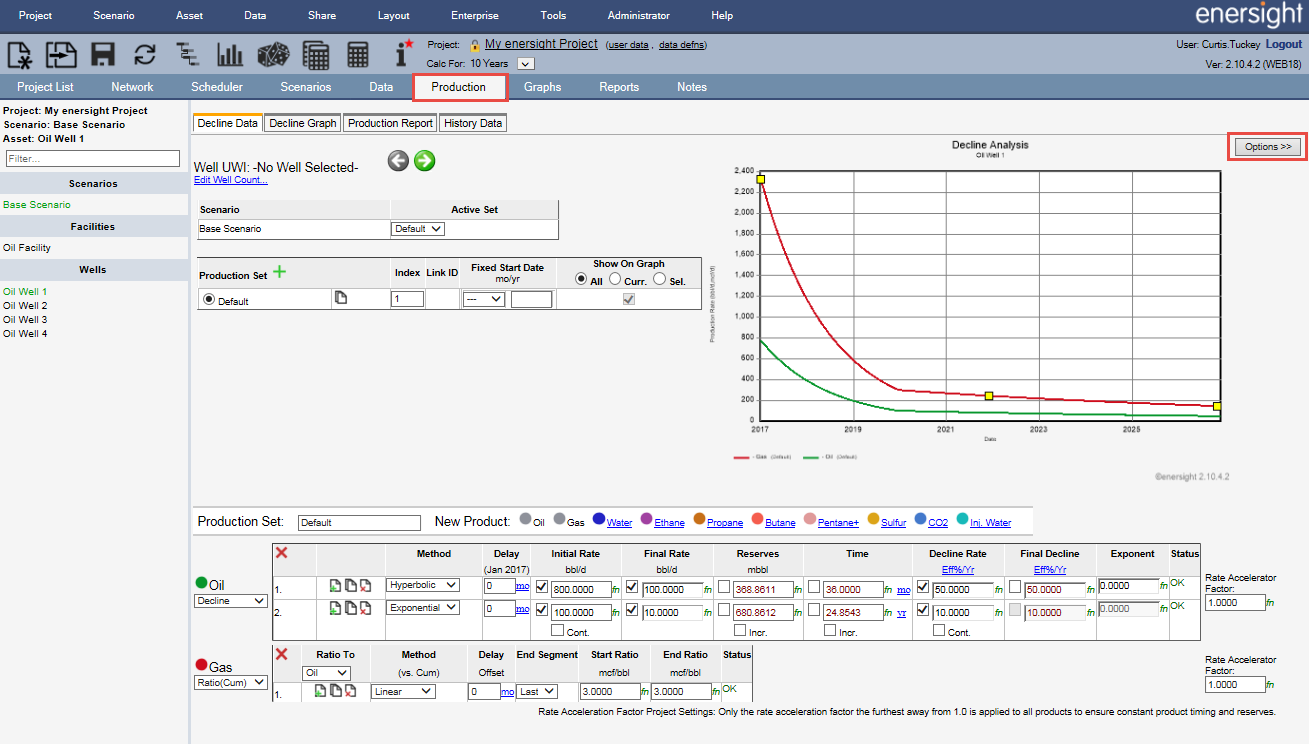
Once the button has been clicked, the decline parameters will hide and the options will appear on the right.
Click image to expand or minimize.
Scaling
- Autoscale X
- This will make two fields available to indicate the first and last values along the x-axis (eg. 2017, 2042).
- Autoscale Y
- This makes two fields editable; the Y-axis, and Y2-axis. The Y-axis is the main (left) axis, and the Y2-axis is the secondary (right) axis. These fields are the minimum and maximum values you want for the given axis (eg. 0, 4000).
- X-axis Cum. Prod
- This will change the x-axis to the cumulative production of a given product. You will be able to see the rate of production for all products once a certain amount of the selected product has been produced. In other words, you can know what your Oil production rate will be when you have produced 400 mboe.
- Log Y-axis
- This will convert he Y-axis in a logarithmic scale, rather than linear.
- Gas/WOR/GOR/WCT on Y2-axis
- If your y axis values are too different to see clearly on a single scale (eg. 500 bbl/d Oil, and 20,000 cf/d Gas), using this option will separate the scales onto different y axes.
Products
- Add/remove any given product or ratio to the decline graph
Options
- Show Decline
- Shows the decline curve as it is currently on the decline data tab
- Show History
- Shows any historical data associated with the Asset
- Show results
- Shows the most recent calculated results as dotted lines, which may be different if the decline curve has been altered since the last calculated
- Show Points
- Shows each data point along the curve
- Show fit through history
- Extrapolates the forecasted decline curve backwards in time to the first period with historical data. This is not a line of best fit through the actuals, but an extension the current forecasted decline curve.
If the x-axis is time, select to show fit through history vs. time, and the same for cumulative production.